


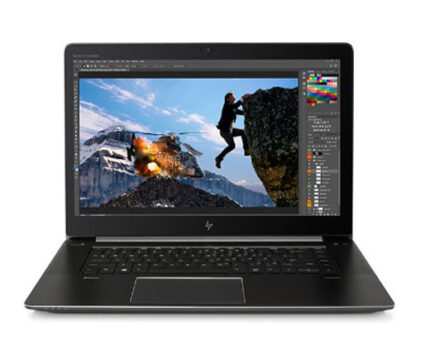


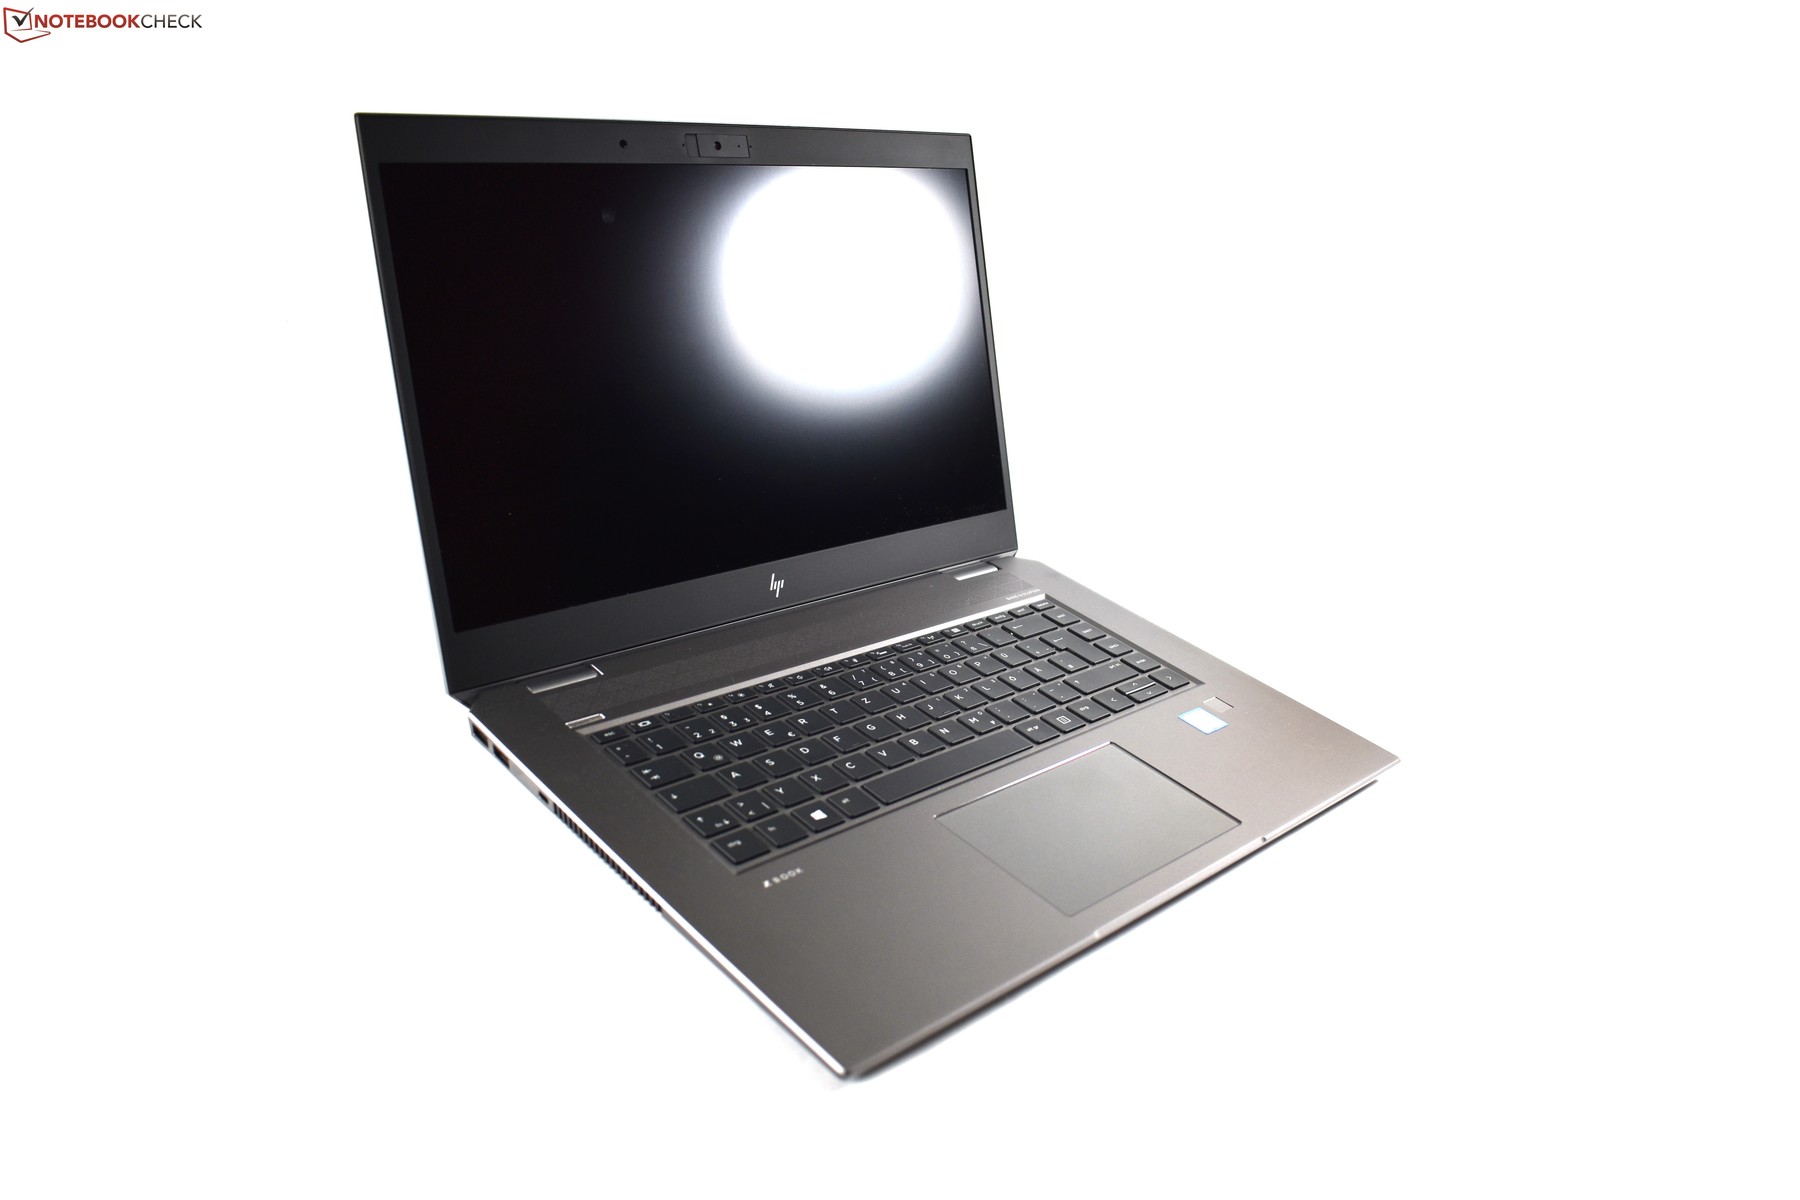
HP ZBook G5 (i7, P1000, 4K) Workstation Review
“ZBook” – this brand name is not very old. Since 2013, HP’s mobile workstations bear this name; before, they were part of the EliteBook laptop series.
Since then, ZBooks have established itself in the workstation sector and HP has continued to expand the line. In 2015, the manufacturer added the first HP ZBook Studio to the line, complementing more classic workstations like the ZBook 15 G3 and the ZBook 17 G3. The new ZBook Studio G3 was different from the existing ZBooks since it combined a slim chassis design with very powerful processors of the Intel Core H-series.
In 2018, HP released the third generation of the ZBook Studio.
The new model ZBook Studio G5 is a complete redesign from its predecessor, the HP ZBook Studio G4, a complete redesign. Also,
for the first time, the ZBook Studio is now available in a multimedia-version, which is carrying the brand HP EliteBook 1050 G1.
The biggest difference between the EliteBook and the ZBook is the different GPU The chassis design is, apart from the slightly darker ZBook-color, identical. That is why we point to the review of the HP EliteBook 1050 G1 for detailed information on the chassis, the connectivity and the input devices.
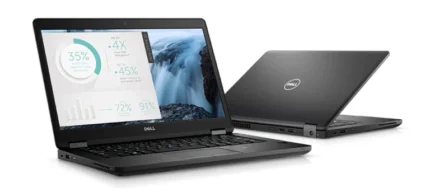
HP, Dell and Lenovo constitute the “Big Three” of the PC market. These manufacturers dominate the workstation sub-market as well, which points to the Dell Precision 5530 and the Lenovo ThinkPad P1 as the main competitors to the ZBook Studio G5. The Apple MacBook Pro 15 2015 also serves a similar customer group as the ZBook Studio, even though it is more of a multimedia than a workstation laptop. HP also makes a machine that is pretty similar to the ZBook Studio G5 in some way, which could also be considered to be a competitor: The ZBook 15u G5 is a thinner workstation as well, which differentiates itself from the ZBook Studio G5 through the use of lower-voltage processors.
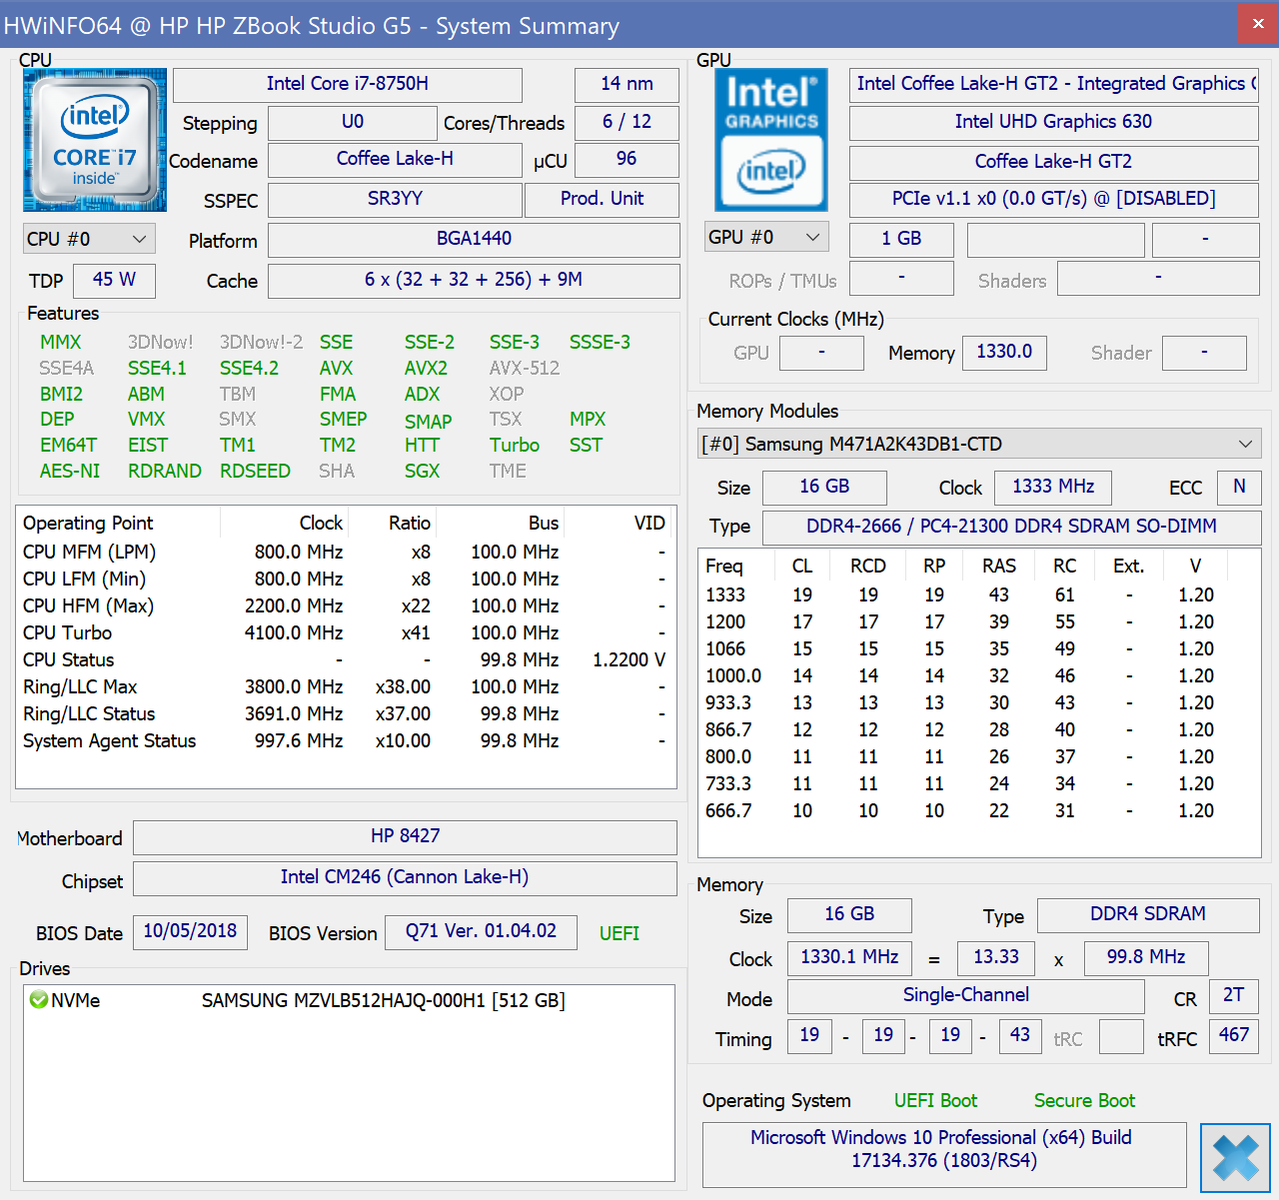
Our review-unit contains the Intel Core i7-8750H, a 512 GB SSD, 16 GB RAM, a 4K UHD display and the Nvidia Quadro P1000. This configuration costs roughly €2,500 in Germany and roughly $2,300 in the USA.
good (84%)HP ZBook Studio G5-4QH10EAIntel Core i7-8750HNVIDIA Quadro P1000Workstation – 03/26/2020 – v7
16 GB
, DDR4-2666, 1 of 2 slots free, maximum 64 GB
Samsung SSD PM981 MZVLB512HAJQ, 512 GB
, M.2 2280, PCIe NVMe, 404 GB free
[+] Add to comparison
Size & weight comparison
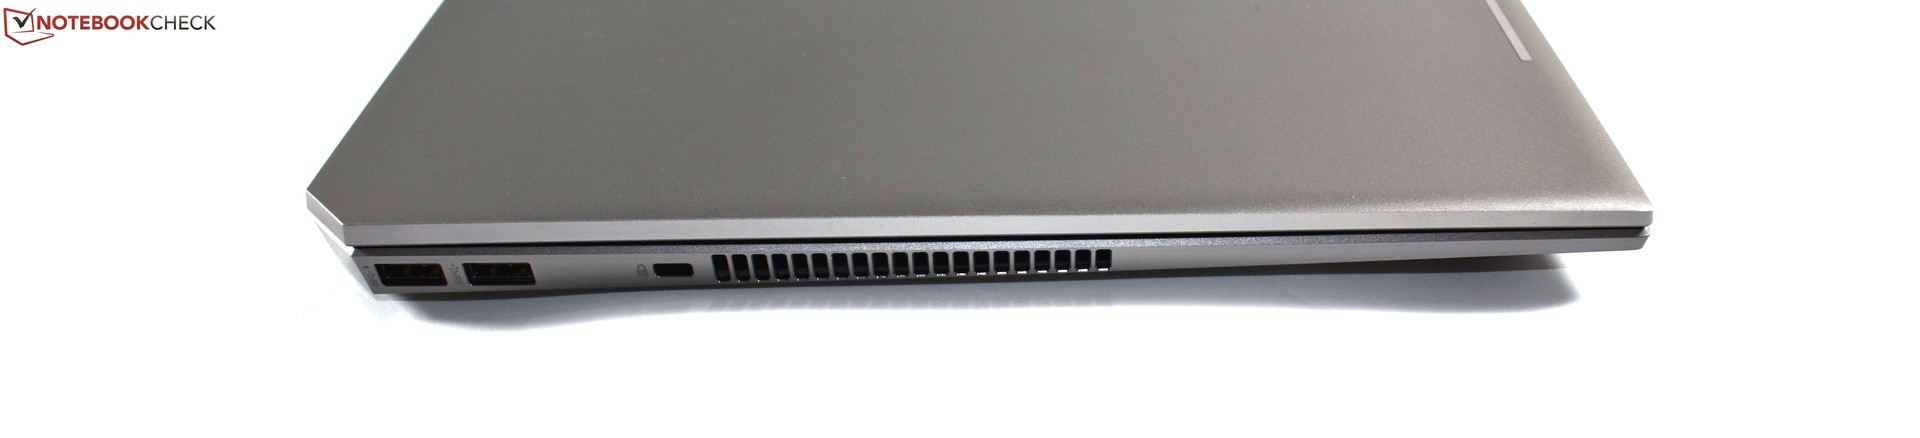
Connectivity
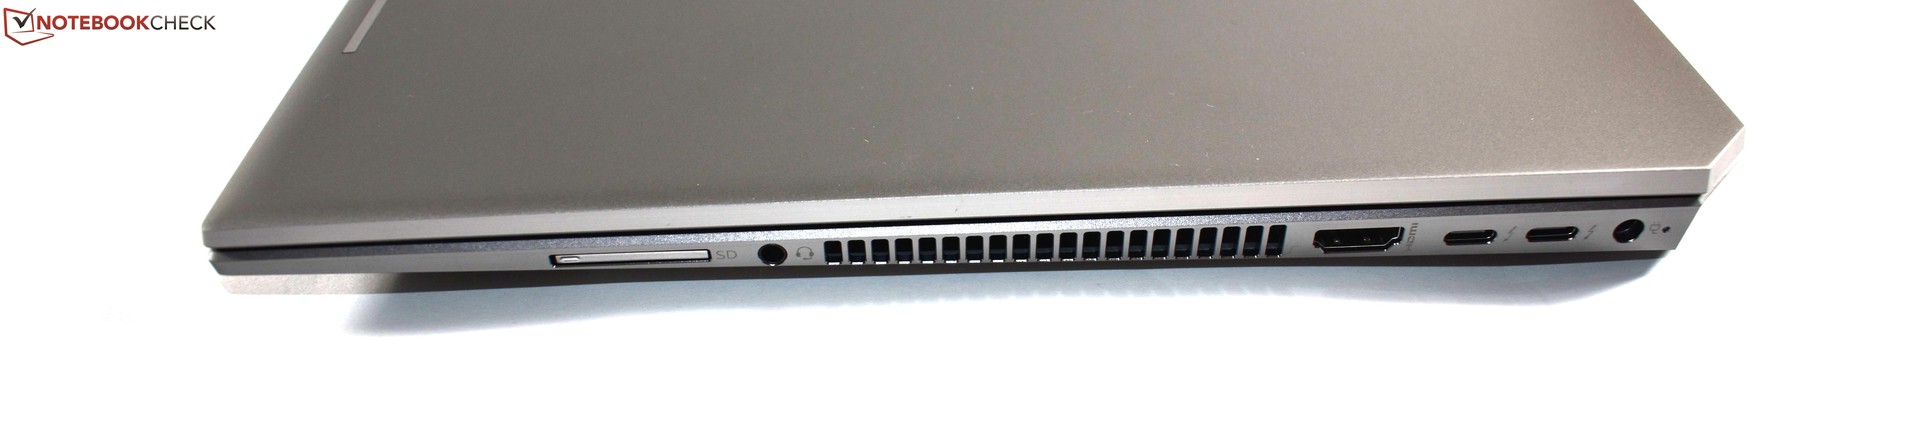
| SD Card Reader | |
| average JPG Copy Test (av. of 3 runs) | |
| HP ZBook Studio G5-4QH10EA (Toshiba Exceria Pro SDXC 64 GB UHS-II) |
|
| Lenovo ThinkPad P1-20MD002LUS (Toshiba Exceria Pro SDXC 64 GB UHS-II) |
|
| Dell Precision 5530 Xeon E-2176M (Toshiba Exceria Pro SDXC 64 GB UHS-II) |
|
| Average of class Workstation (60.6 – 207, n=25, last 2 years) |
|
| maximum AS SSD Seq Read Test (1GB) | |
| Lenovo ThinkPad P1-20MD002LUS (Toshiba Exceria Pro SDXC 64 GB UHS-II) |
|
| HP ZBook Studio G5-4QH10EA (Toshiba Exceria Pro SDXC 64 GB UHS-II) |
|
| Dell Precision 5530 Xeon E-2176M (Toshiba Exceria Pro SDXC 64 GB UHS-II) |
|
| Average of class Workstation (79.6 – 262, n=25, last 2 years) |
|
| Networking | |
| iperf3 transmit AX12 | |
| Average of class Workstation (767 – 1506, n=27, last 2 years) |
|
| Dell Precision 5530 Xeon E-2176M |
|
| Lenovo ThinkPad P1-20MD002LUS |
|
| HP ZBook Studio G5-4QH10EA |
|
| Apple MacBook Pro 15 2018 (2.6 GHz, 560X) |
|
| HP ZBook 15u G5 2ZC05EA |
|
| iperf3 receive AX12 | |
| Average of class Workstation (579 – 1553, n=27, last 2 years) |
|
| Apple MacBook Pro 15 2018 (2.6 GHz, 560X) |
|
| Lenovo ThinkPad P1-20MD002LUS |
|
| HP ZBook Studio G5-4QH10EA |
|
| Dell Precision 5530 Xeon E-2176M |
|
| HP ZBook 15u G5 2ZC05EA |
|
Display

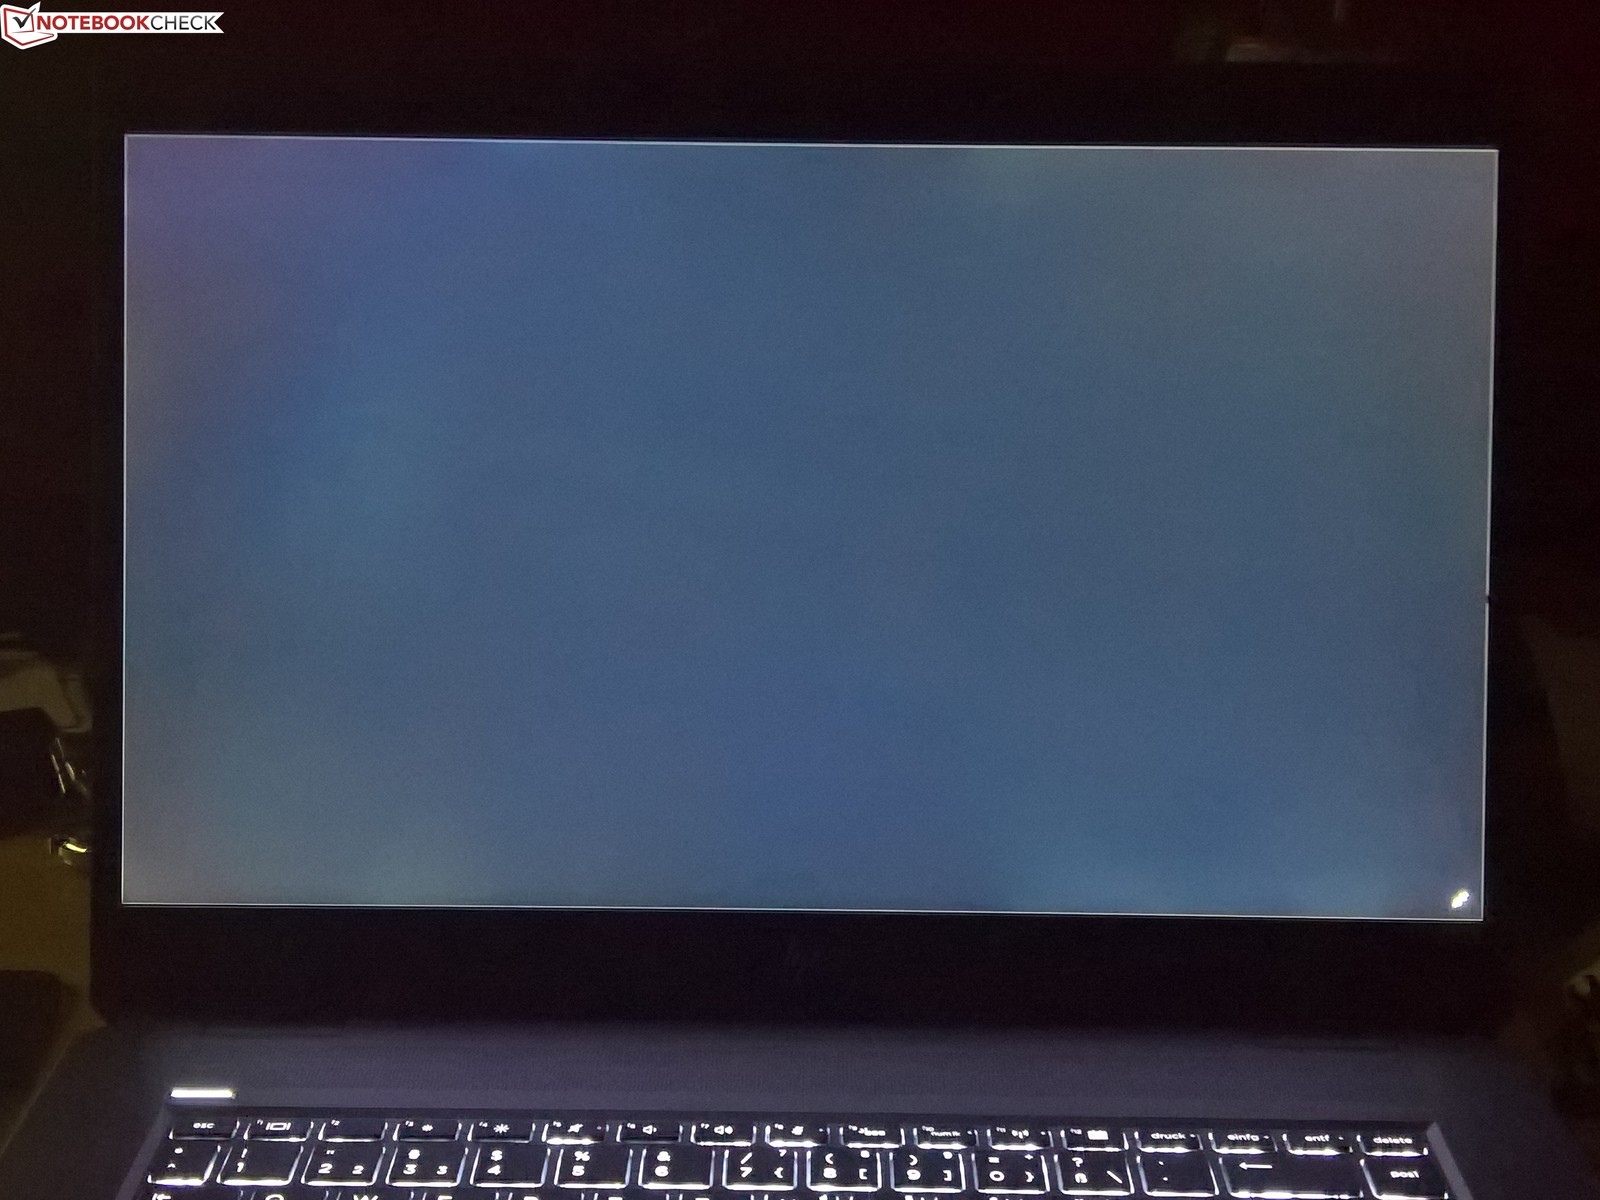
There are a number of different 15.6-inch screen options. Our review-unit for example sports a matte 4K UHD (3,840 x 2,160) screen, but the ZBook Studio is also available with a matte FHD (1,920 x 1,080) screen with 400 cd/m². Additionally, there is a matte 4K UHD panel, which sports the ‘Dreamcolor’ name. This LCD is supposed to be exceptionally bright (600 cd/m²) and colorful (100% AdobeRGB). These are the three display options that are available right now. In the spec-sheet, HP lists a glossy FHD screen with the ‘SureView’ privacy-filter and 650 cd/m² brightness. All offered LCD panels are based on IPS technology.
The non-Dreamcolor 4K UHD panel in our unit is supposed to hit 400 cd/m² of brightness according to HP. It certainly does reach this level of brightness and even manages to exceed it with an average brightness of 412 cd/m². This means that the used LCD panel by AUO is brighter than the nominally identical AUO screen in the HP EliteBook 1050 G1 – another example for the always-popular variance in part quality.
Compared with the competition, the display performs well enough in terms of brightness. The LCD panels used in the Dell Precision 5530 and Apple MacBook Pro 15 2018 are brighter, but the screen of the Lenovo ThinkPad P1 is slightly darker. If users wish for an even brighter panel, one must not forget that HP also offers the Dreamcolor screen as an option.
There was no notable PWM; the same is true for backlight bleeding. The brightness distribution of 85% is acceptable. With the naked eye, no dark spots were visible.
|
|||||||||||||||||||||||||
Distribution of brightness
Maximum: 450 cd/m² (Nits) Average: 412.4 cd/m² Minimum: 35 cd/m²
Brightness Distribution: 85 %
Center on Battery: 418 cd/m²
Contrast: 1438:1 (Black: 0.29 cd/m²)
ΔE Color 4.4 | 0.59-29.43 Ø5.3, calibrated: 1.9
ΔE Greyscale 5 | 0.57-98 Ø5.5
96% sRGB (Argyll 1.6.3 3D)
62.3% AdobeRGB 1998 (Argyll 1.6.3 3D)
68.8% AdobeRGB 1998 (Argyll 2.2.0 3D)
96.2% sRGB (Argyll 2.2.0 3D)
68.2% Display P3 (Argyll 2.2.0 3D)
Gamma: 2.28
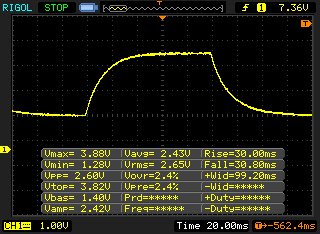
Display Response Times
Display response times show how fast the screen is able to change from one color to the next. Slow response times can lead to afterimages and can cause moving objects to appear blurry (ghosting). Gamers of fast-paced 3D titles should pay special attention to fast response times.
| ↔ Response Time Black to White | ||
|---|---|---|
| 32.8 ms … rise ↗ and fall ↘ combined | ↗ 16.4 ms rise |
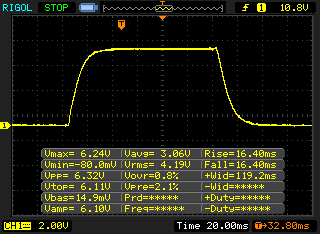 |
| ↘ 16.4 ms fall | ||
| The screen shows slow response rates in our tests and will be unsatisfactory for gamers. In comparison, all tested devices range from 0.4 (minimum) to 240 (maximum) ms. » 85 % of all devices are better. This means that the measured response time is worse than the average of all tested devices (22.8 ms). |
||
| ↔ Response Time 50% Grey to 80% Grey | ||
| 60.8 ms … rise ↗ and fall ↘ combined | ↗ 30 ms rise |
 |
| ↘ 30.8 ms fall | ||
| The screen shows slow response rates in our tests and will be unsatisfactory for gamers. In comparison, all tested devices range from 0.25 (minimum) to 636 (maximum) ms. » 96 % of all devices are better. This means that the measured response time is worse than the average of all tested devices (36 ms). |
||
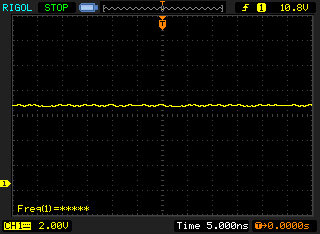
Screen Flickering / PWM (Pulse-Width Modulation)
To dim the screen, some notebooks will simply cycle the backlight on and off in rapid succession – a method called Pulse Width Modulation (PWM) . This cycling frequency should ideally be undetectable to the human eye. If said frequency is too low, users with sensitive eyes may experience strain or headaches or even notice the flickering altogether.
| Screen flickering / PWM not detected |
 |
||
| In comparison: 53 % of all tested devices do not use PWM to dim the display. If PWM was detected, an average of 19692 (minimum: 5 – maximum: 3846000) Hz was measured. | |||
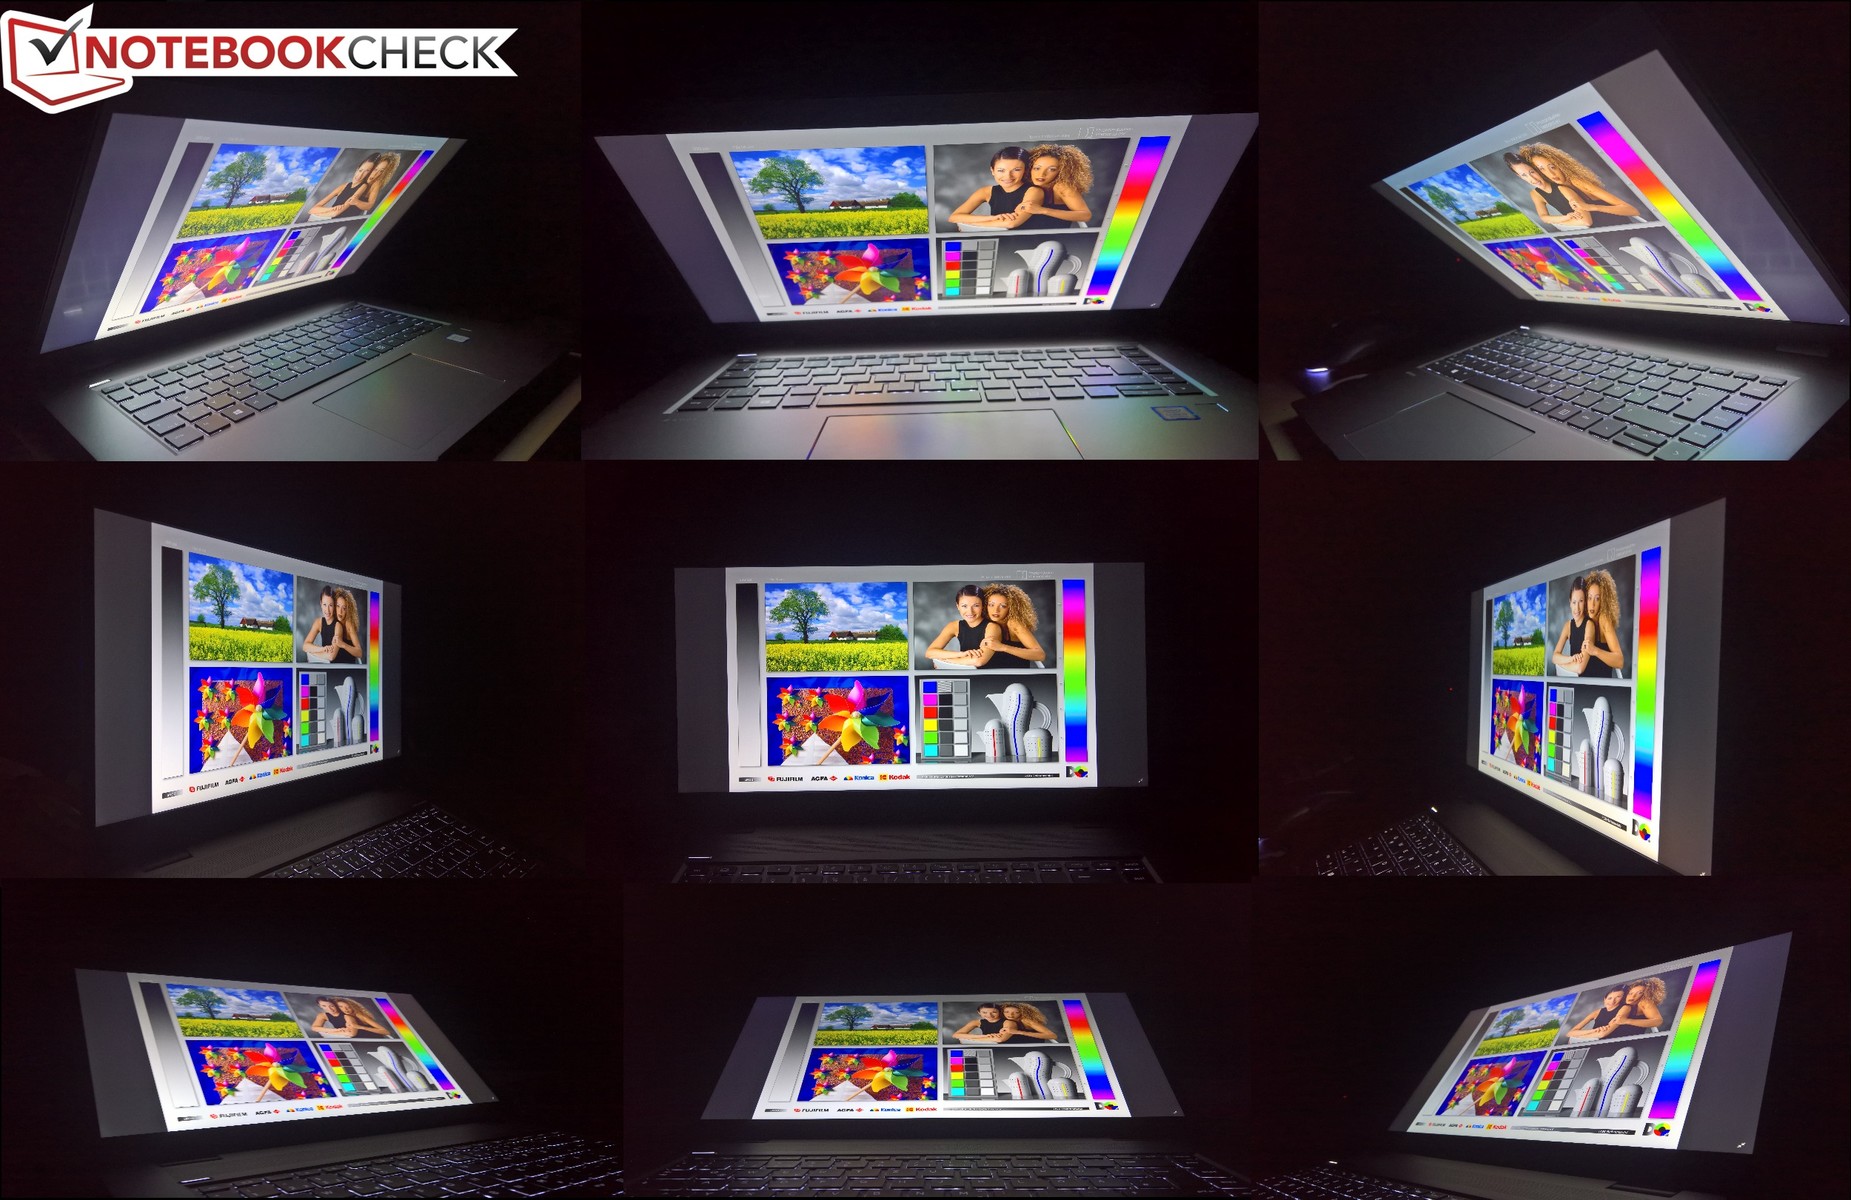
Typical for an IPS panel: The viewing-angle-stability is pretty much perfect.
Performance
HP offers the ZBook with a number of different Intel CPU options: Two i5 processors (Core i5-8300H & Core i5-8400H), two i7 processors (Core i7-8750H & Core i7-8850H), two Xeon CPUs (Xeon E-2176M & Xeon E-2186M) and the Core i9-8950HK. Theoretically, there should also be a choice when it comes to the dedicated GPU, but in reality, only the Nvidia Quadro P1000 is available. Admittedly, the Nvidia Quadro P2000 is listed in the spec-sheet, but it is simply not available. This means that there is no upgrade, though a GPU-downgrade is possible: The ZBook can be ordered without a dGPU, in which case the Intel UHD Graphics 630 takes care of the graphics.
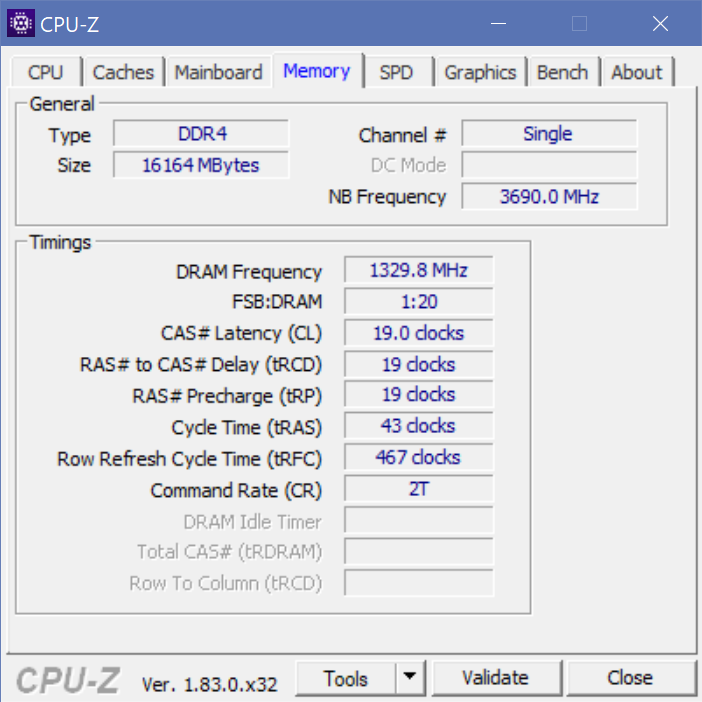
In terms of RAM, there are options to order the ZBook with either 8, 16 or 32 GB DDR4-2666-RAM, optionally on the Xeon models as ECC RAM. With the RAM sockets, the ZBook can be upgraded to a maximum amount of 64 GB. Additionally, the ZBook has two M.2 2280 slots for SSDs as well, so it is a very upgradeable machine. Ex factory, the HP laptop can be configured with 256 GB, 512 GB, 1 TB or 2 TB.
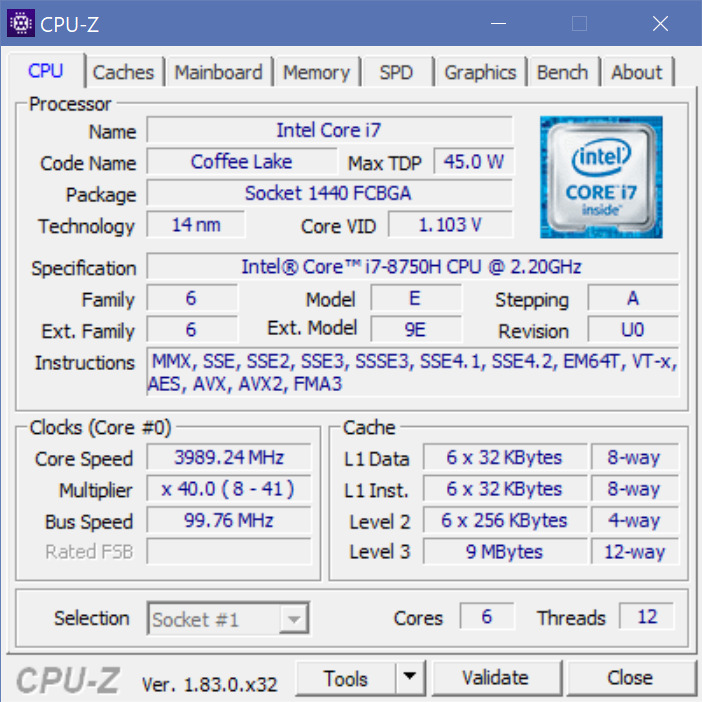
Processor
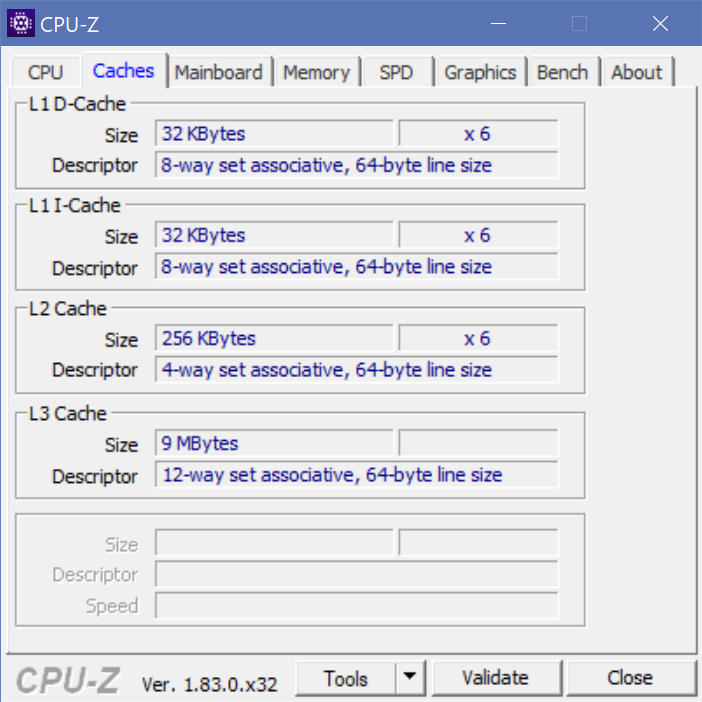
The Intel Core i7-8750H is one of the most used processors of the Coffee Lake H series, which includes very powerful CPUs with a TDP of 45 W. In the case of the i7-8750H, there are six CPU cores, which make this CPU a hexa-core chip. Those cores have a clock-speed-range of 2.2 to 4.1 GHz.
This maximum turbo-boost is not reached in the Cinebench multicore loop. Instead, the CPU cores can achieve 3.9 GHz and hold that clock-speed for 30 seconds, consuming 60 W while doing so. After 30 seconds, the consumption is limited to 45 W, which means that the CPU works with 3 GHz. In the 30-minute long loop, this power level can be retained for the remainder of the test, the higher performance-level of 3.9 GHz is only achievable in the very first iteration of the test.
Compared with the competitors Dell Precision 5530 and the Lenovo ThinkPad P1, the ZBook Studio G5 achieved roughly the same level of performance. Under sustained load, the HP notebook delivered the lowest performance on average, but the difference is pretty small. Overall, the CPU performance of the ZBook Studio G5 is very good. However, CPU upgrades beyond the Core i7-8750H will most likely not result in an increased multicore-performance. The cooling system is already working to capacity here.
While using the ZBook without an attached charger, the CPU performance is reduced. Instead of 1100 points, the ZBook Studio G5 just reaches roughly 950 points in the Cinebench R15 multicore test.
| Cinebench R15 | |
| CPU Single 64Bit | |
| Average of class Workstation (180 – 269, n=33, last 2 years) |
|
| Dell Precision 5530 Xeon E-2176M |
|
| Lenovo ThinkPad P1-20MD002LUS |
|
| Apple MacBook Pro 15 2018 (2.6 GHz, 560X) |
|
| HP EliteBook 1050 G1-4QY20EA |
|
| HP ZBook Studio G5-4QH10EA |
|
| HP ZBook 15u G5 2ZC05EA |
|
| Average Intel Core i7-8750H (163 – 177, n=86) |
|
| CPU Multi 64Bit | |
| Average of class Workstation (697 – 2518, n=34, last 2 years) |
|
| HP EliteBook 1050 G1-4QY20EA |
|
| HP ZBook Studio G5-4QH10EA |
|
| Lenovo ThinkPad P1-20MD002LUS |
|
| Average Intel Core i7-8750H (863 – 1251, n=93) |
|
| Dell Precision 5530 Xeon E-2176M |
|
| Apple MacBook Pro 15 2018 (2.6 GHz, 560X) |
|
| Apple MacBook Pro 15 2018 (2.6 GHz, 560X) |
|
| Apple MacBook Pro 15 2018 (2.6 GHz, 560X) |
|
| Apple MacBook Pro 15 2018 (2.6 GHz, 560X) |
|
| HP ZBook 15u G5 2ZC05EA |
|
System Performance
In the PCMark-benchmarks, the ZBook Studio G5 places itself at the end of the ranking, though in everyday use, the system performance was not bad. On the contrary, the system always ran smoothly.
| PCMark 10 | |
| Score | |
| Average of class Workstation (4171 – 7156, n=31, last 2 years) |
|
| Dell Precision 5530 Xeon E-2176M |
|
| Apple MacBook Pro 15 2018 (2.6 GHz, 560X) |
|
| HP EliteBook 1050 G1-4QY20EA |
|
| Lenovo ThinkPad P1-20MD002LUS |
|
| Average Intel Core i7-8750H, NVIDIA Quadro P1000 (4428 – 4735, n=3) |
|
| HP ZBook Studio G5-4QH10EA |
|
| HP ZBook 15u G5 2ZC05EA |
|
| Essentials | |
| Average of class Workstation (8059 – 10894, n=31, last 2 years) |
|
| Apple MacBook Pro 15 2018 (2.6 GHz, 560X) |
|
| Dell Precision 5530 Xeon E-2176M |
|
| Average Intel Core i7-8750H, NVIDIA Quadro P1000 (7739 – 9007, n=3) |
|
| Lenovo ThinkPad P1-20MD002LUS |
|
| HP EliteBook 1050 G1-4QY20EA |
|
| HP ZBook 15u G5 2ZC05EA |
|
| HP ZBook Studio G5-4QH10EA |
|
| Productivity | |
| Average of class Workstation (6426 – 9604, n=31, last 2 years) |
|
| Apple MacBook Pro 15 2018 (2.6 GHz, 560X) |
|
| Dell Precision 5530 Xeon E-2176M |
|
| Lenovo ThinkPad P1-20MD002LUS |
|
| HP ZBook 15u G5 2ZC05EA |
|
| HP EliteBook 1050 G1-4QY20EA |
|
| Average Intel Core i7-8750H, NVIDIA Quadro P1000 (6573 – 6749, n=3) |
|
| HP ZBook Studio G5-4QH10EA |
|
| Digital Content Creation | |
| Average of class Workstation (3229 – 10241, n=31, last 2 years) |
|
| Dell Precision 5530 Xeon E-2176M |
|
| HP EliteBook 1050 G1-4QY20EA |
|
| HP ZBook Studio G5-4QH10EA |
|
| Lenovo ThinkPad P1-20MD002LUS |
|
| Average Intel Core i7-8750H, NVIDIA Quadro P1000 (4348 – 4742, n=3) |
|
| Apple MacBook Pro 15 2018 (2.6 GHz, 560X) |
|
| HP ZBook 15u G5 2ZC05EA |
|
HP does not cheap out when it comes to the SSD: The American manufacturer uses the Samsung PM981 with a capacity of 512 GB. This PCIe NVMe SSD in the M.2 format is extremely fast and showed no weaknesses in the benchmarks.

Sequential Read: 1429 MB/s
Sequential Write: 1423 MB/s
512K Read: 758 MB/s
512K Write: 1775 MB/s
4K Read: 56.5 MB/s
4K Write: 107.1 MB/s
4K QD32 Read: 347.1 MB/s
4K QD32 Write: 279.1 MB/s
GPU
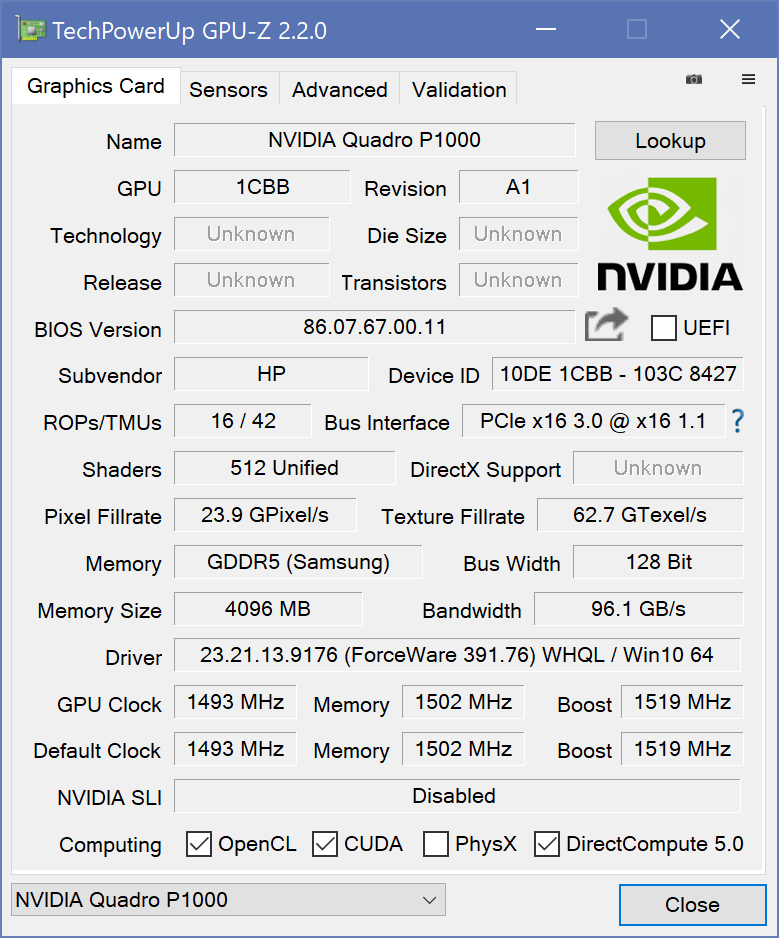
The Nvidia Quadro P1000 is a CAD-optimized GPU of the lower middle-class. More detailed comparisons with other GPUs are possible with our GPU benchmark-list.
It is not surprising that the Quadro P1000 is slower than the Quadro P2000. The Max-Q version of the Quadro P2000 is faster in all benchmarks as well. More interesting is the comparison with the Nvidia GeForce GTX 1050 Max-Q, which is used in the almost identical HP EliteBook 1050 G1. The Quadro P1000 is 15 to 20% slower than the Nvidia GeForce GTX 1050 Max-Q in the 3DMark-benchmarks. In the LuxMark test, the consumer GPU is also clearly faster.
The GPU performance is not limited when the machine is running on battery.
| 3DMark 11 – 1280×720 Performance GPU | |
| Average of class Workstation (4110 – 41904, n=30, last 2 years) |
|
| Dell Precision 5530 Xeon E-2176M |
|
| Lenovo ThinkPad P1-20MD002LUS |
|
| Apple MacBook Pro 15 2018 (2.6 GHz, 560X) |
|
| HP EliteBook 1050 G1-4QY20EA |
|
| Average NVIDIA Quadro P1000 (5982 – 6115, n=3) |
|
| HP ZBook Studio G5-4QH10EA |
|
| HP ZBook 15u G5 2ZC05EA |
|
Gaming Performance
Gaming is certainly not the specialty of a workstation, but a little bit of fun with a game after a long day of work is not necessarily a bad thing. The Quadro P1000 offers a basic ability to play modern games. However, it should be noted that games that are more recent would not be playable with the maximum details or in 4K UHD. Compared with the GeForce GTX 1050 Max-Q in the EliteBook 1050 G1 , the GeForce easily beats out the Quadro when it comes to playing games, because it simply offers more performance overall.
The performance that the Quadro P1000 does offer is available even under continuous load, which is what our Witcher 3 loop shows.
| The Witcher 3 – 1920×1080 High Graphics & Postprocessing (Nvidia HairWorks Off) | |
| Average of class Workstation (18.7 – 179, n=29, last 2 years) |
|
| HP EliteBook 1050 G1-4QY20EA |
|
| Dell Precision 5530 Xeon E-2176M |
|
| Lenovo ThinkPad P1-20MD002LUS |
|
| HP ZBook Studio G5-4QH10EA |
|
| Average NVIDIA Quadro P1000 (26.1 – 29.9, n=3) |
|
| low | med. | high | ultra | 4K | |
| BioShock Infinite (2013) | 249.7 | 152.2 | 133.7 | 51 | |
| The Witcher 3 (2015) | 88.7 | 54.4 | 29.5 | 16.1 | |
| Rise of the Tomb Raider (2016) | 100.1 | 57.5 | 32.3 | 27 | 10.6 |
Emissions
System noise
While idling, the active cooling system, which consists of two fans in the ZBook Studio G5, is most often deactivated. If the fans come on, they are louder than the Lenovo ThinkPad P1 fans, but quieter than the EliteBook 1050 G1 and ZBook Studio x360 G5 cooling systems. Under load, the cooling system is constantly active, but the fan-noise is not extremely loud. One thing to note is that the noise, overall, is lower frequency when compared with the EliteBook 1050 G1. Probably, HP is using different fans from multiple parts manufacturers.
Like so many laptops, the ZBook Studio G5 suffers from electronic noise. Though it is not very loud; to hear it, one must hold an ear directly next to the keyboard.
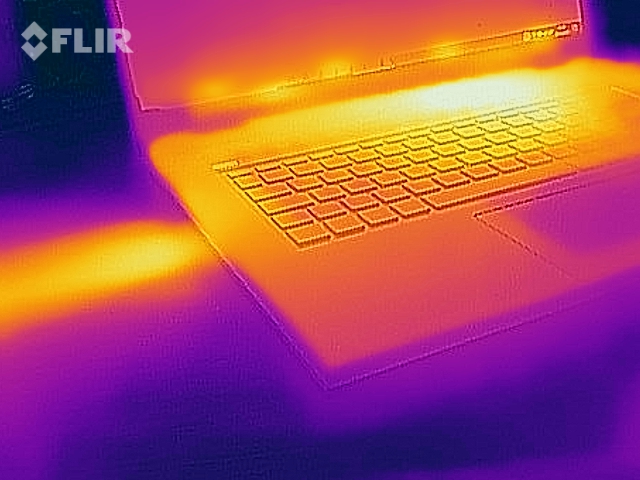
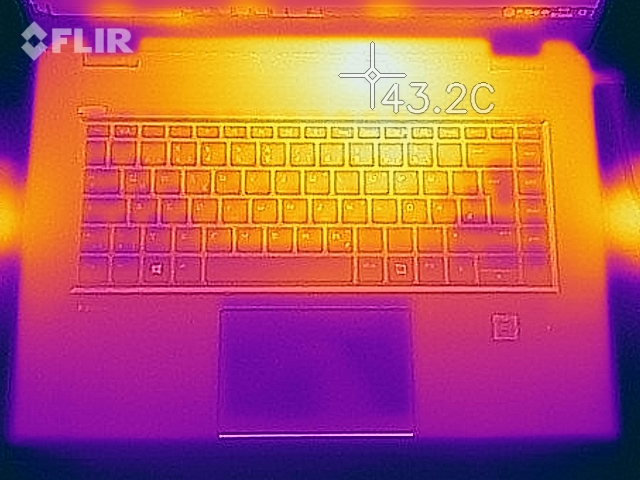
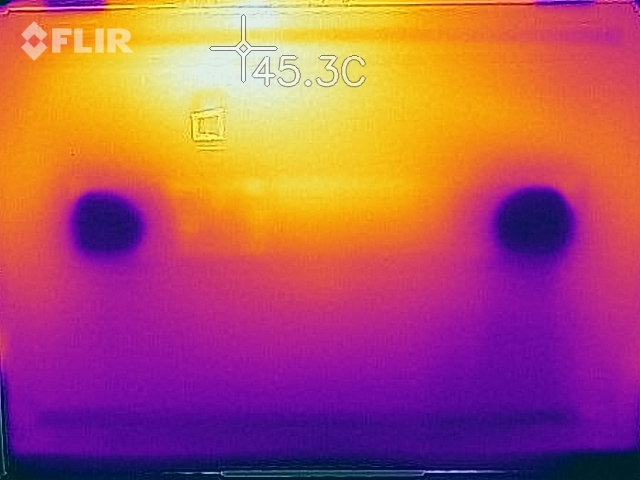
The temperatures are hovering around a similar level as they do on the ZBook Studio x360 G5. The outer temperatures are even lower. With a maximum temperature of 43.1 °C (~110 °F), it is hard to claim that the temperatures are too high.
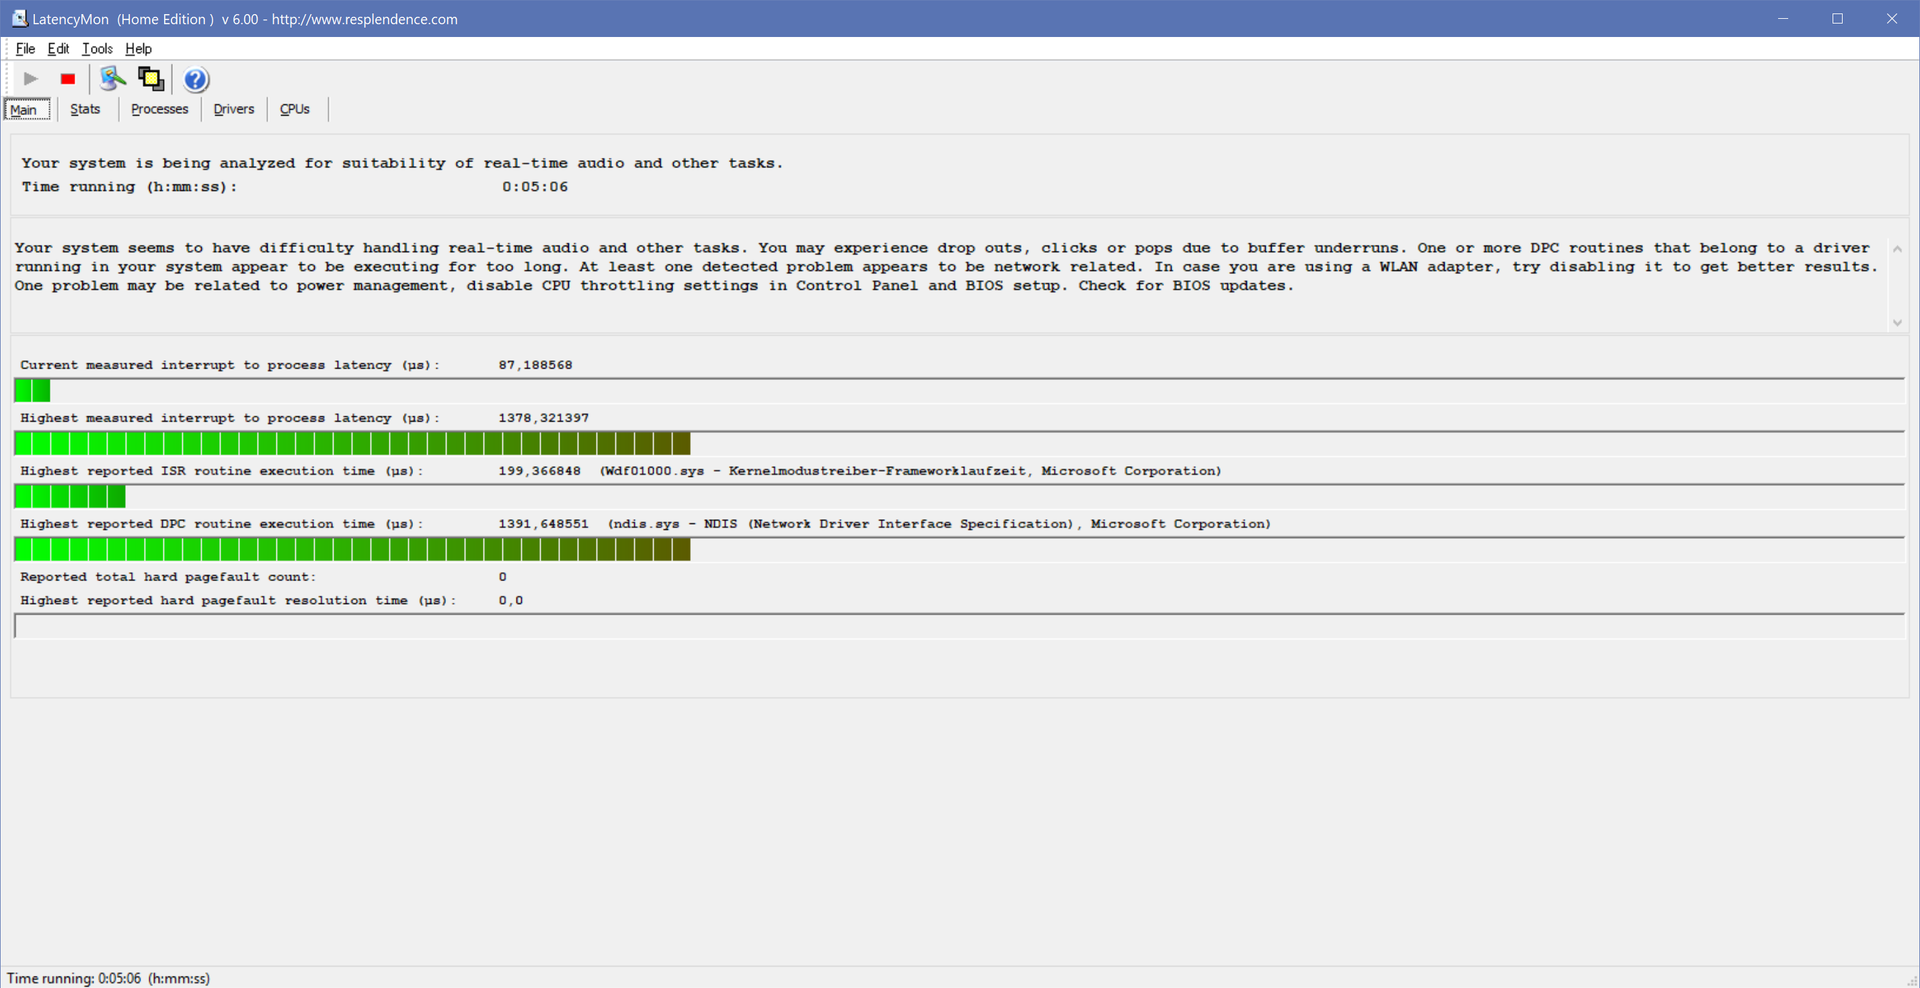
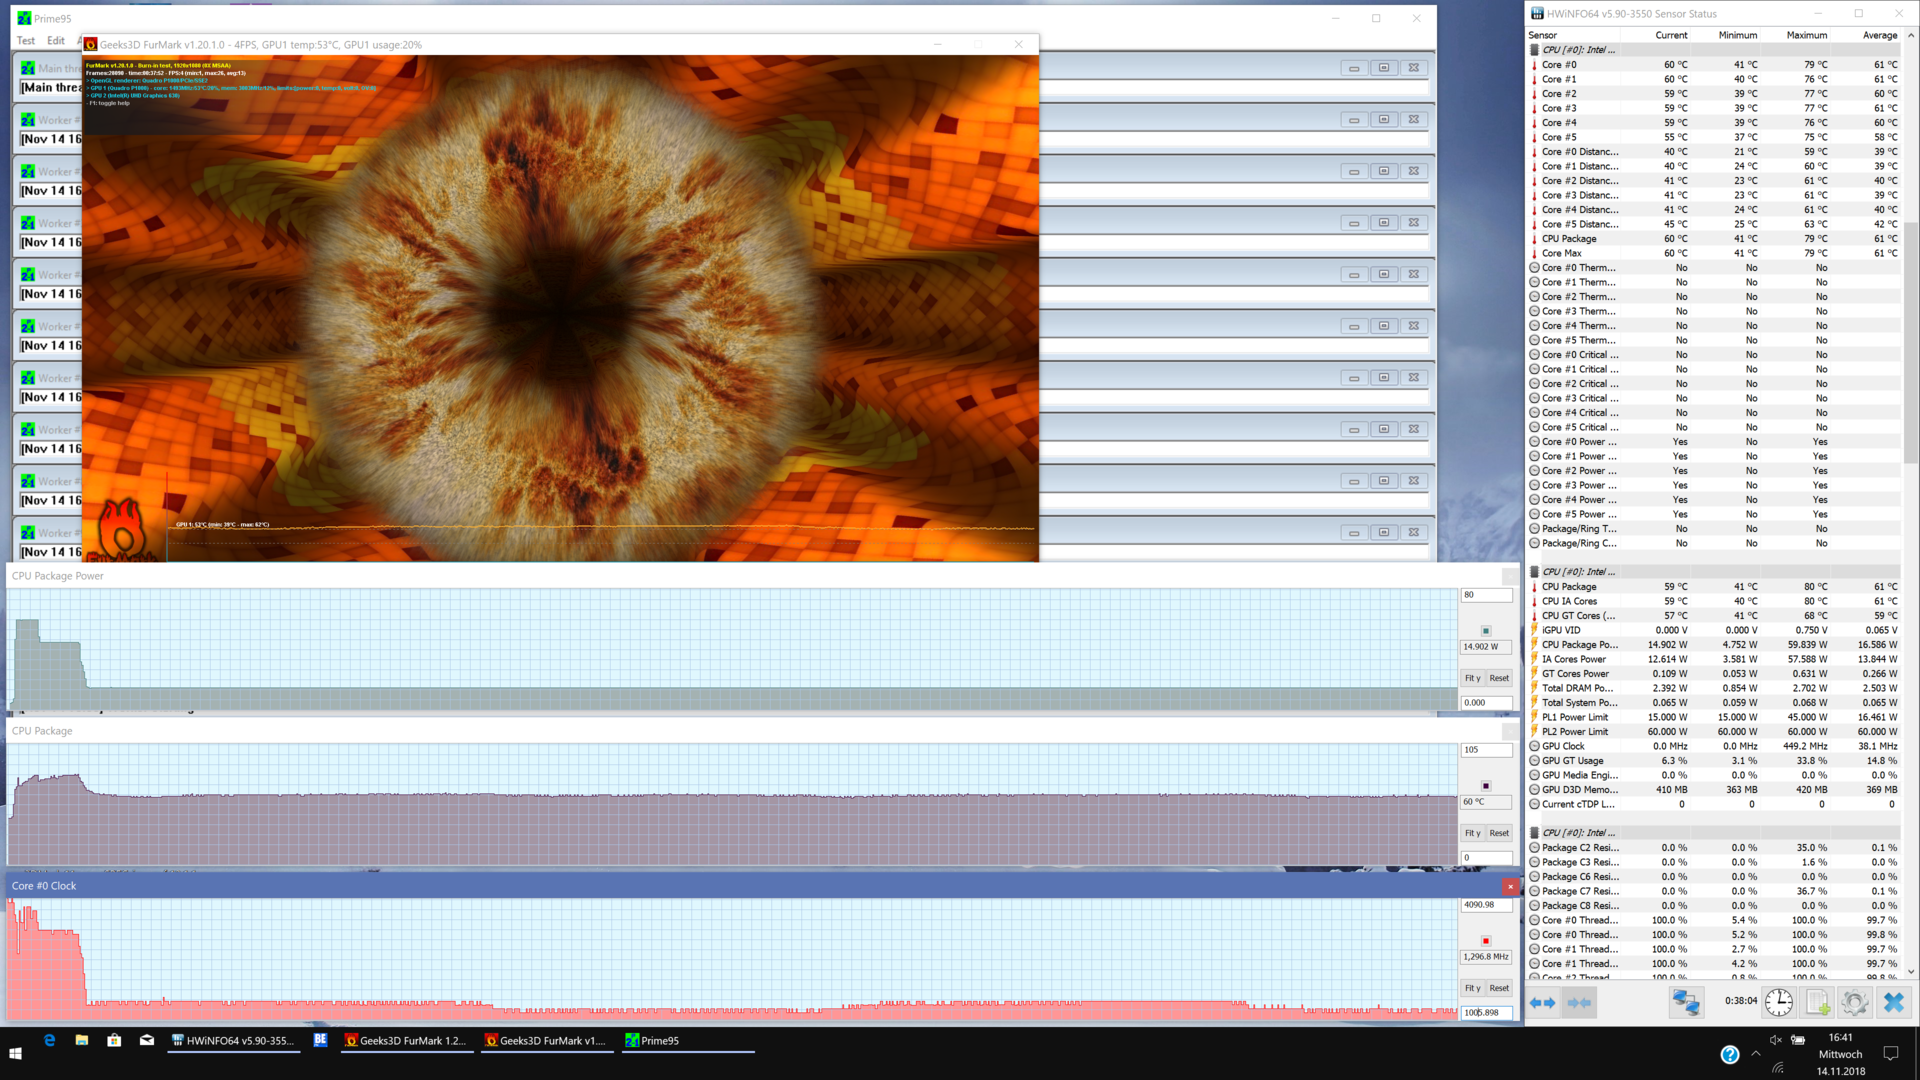
The stress test with Prime95 and FurMark proceeds almost exactly as it does with the convertible model: The processor can reach 3.9 GHz for short a amount of time, until the clock-rate goes down to 1.3 GHz. This happens, because the power consumption is now limited to 15 W. Different from the convertible x360 model, the CPU cannot occasionally ramp up its clock speed for short bursts in the later progression of the test. Instead, the CPU performance stays on a low level. Meanwhile, the GPU can hold its maximum performance level with some minor deviations for the whole course of the test. The follow-up 3DMark11 resulted in a score on the normal level, which means that the throttling in the stress test is of little importance for everyday use.
|
|||||||||||||||||||||||||
| Maximum: 42.3 °C = 108 F Average: 33 °C = 91 F |
|||||||||||||||||||||||||
|
|||||||||||||||||||||||||
| Maximum: 43.1 °C = 110 F Average: 33.2 °C = 92 F |
|||||||||||||||||||||||||
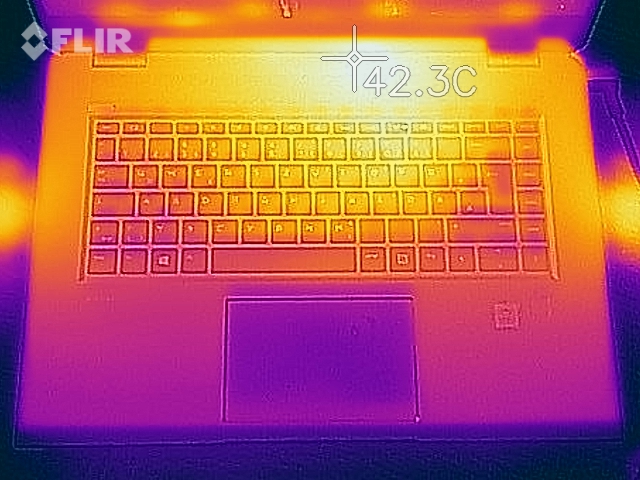
(±) The maximum temperature on the upper side is 42.3 °C / 108 F, compared to the average of 37.9 °C / 100 F, ranging from 22.2 to 69.8 °C for the class Workstation.
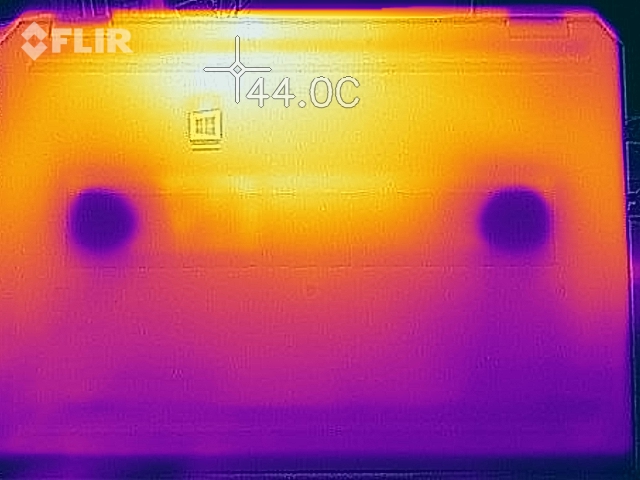
(±) The bottom heats up to a maximum of 43.1 °C / 110 F, compared to the average of 41.4 °C / 107 F
(+) In idle usage, the average temperature for the upper side is 23.2 °C / 74 F, compared to the device average of 31.8 °C / 89 F.
(±) Playing The Witcher 3, the average temperature for the upper side is 34.8 °C / 95 F, compared to the device average of 31.8 °C / 89 F.
(+) The palmrests and touchpad are cooler than skin temperature with a maximum of 29.6 °C / 85.3 F and are therefore cool to the touch.
(±) The average temperature of the palmrest area of similar devices was 27.8 °C / 82 F (-1.8 °C / -3.3 F).
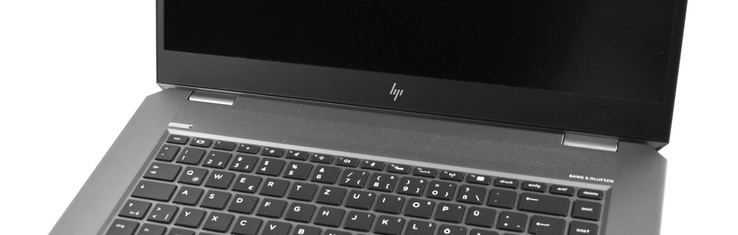
Speakers
HP puts the speakers between the keyboard and the hinges. They are marked with the “Bang&Oluflsen” logo and they are user facing, different from speakers of the Lenovo ThinkPad P1 or the Dell Precision 5530. Those machines have speakers at the bottom of the system, which could sometimes impair sound quality. For a laptop, the speakers of the ZBook Studio G5 are pretty good. Their quality is better compared with the ThinkPad P1 and pretty much on the same level as the Precision 5530; though their positioning definitely gives a small advantage to the ZBook over the Precision as well.
The combo audio port worked flawlessly and offered a very good alternative to the speakers, as always.
HP ZBook Studio G5-4QH10EA audio analysis
(±) | speaker loudness is average but good (76.2 dB)
Bass 100 – 315 Hz
(±) | reduced bass – on average 8.5% lower than median
(±) | linearity of bass is average (10.7% delta to prev. frequency)
Mids 400 – 2000 Hz
(±) | higher mids – on average 6% higher than median
(±) | linearity of mids is average (7% delta to prev. frequency)
Highs 2 – 16 kHz
(+) | balanced highs – only 4.1% away from median
(+) | highs are linear (6.5% delta to prev. frequency)
Overall 100 – 16.000 Hz
(±) | linearity of overall sound is average (15% difference to median)
Compared to same class
» 28% of all tested devices in this class were better, 14% similar, 58% worse
» The best had a delta of 6%, average was 17%, worst was 31%
Compared to all devices tested
» 20% of all tested devices were better, 5% similar, 76% worse
» The best had a delta of 3%, average was 20%, worst was 65%
Lenovo ThinkPad P1-20MD002LUS audio analysis
(±) | speaker loudness is average but good (73.7 dB)
Bass 100 – 315 Hz
(±) | reduced bass – on average 10.1% lower than median
(±) | linearity of bass is average (12.3% delta to prev. frequency)
Mids 400 – 2000 Hz
(±) | higher mids – on average 5.9% higher than median
(±) | linearity of mids is average (8.9% delta to prev. frequency)
Highs 2 – 16 kHz
(+) | balanced highs – only 2% away from median
(+) | highs are linear (5.1% delta to prev. frequency)
Overall 100 – 16.000 Hz
(±) | linearity of overall sound is average (18.1% difference to median)
Compared to same class
» 59% of all tested devices in this class were better, 10% similar, 31% worse
» The best had a delta of 6%, average was 17%, worst was 31%
Compared to all devices tested
» 38% of all tested devices were better, 8% similar, 54% worse
» The best had a delta of 3%, average was 20%, worst was 65%
Dell Precision 5530 Xeon E-2176M audio analysis
(±) | speaker loudness is average but good (74.9 dB)
Bass 100 – 315 Hz
(-) | nearly no bass – on average 17.9% lower than median
(±) | linearity of bass is average (9.1% delta to prev. frequency)
Mids 400 – 2000 Hz
(±) | higher mids – on average 6.7% higher than median
(±) | linearity of mids is average (10.2% delta to prev. frequency)
Highs 2 – 16 kHz
(+) | balanced highs – only 4% away from median
(±) | linearity of highs is average (8.4% delta to prev. frequency)
Overall 100 – 16.000 Hz
(±) | linearity of overall sound is average (21.6% difference to median)
Compared to same class
» 77% of all tested devices in this class were better, 5% similar, 17% worse
» The best had a delta of 6%, average was 17%, worst was 31%
Compared to all devices tested
» 61% of all tested devices were better, 7% similar, 31% worse
» The best had a delta of 3%, average was 20%, worst was 65%
Power Management
Power consumption
The competitors by Lenovo and Dell perform much worse when it comes to the energy consumption. The ZBook just runs with less power consumption, especially when idle. The comparison is most unfavorable for the Dell Precision 5530. Some machines do consume less energy than the ZBook Studio G5 though, this includes the Apple MacBook Pro 15, the HP EliteBook 1050 G1 and especially the ZBook 15u G5. This last model needs less energy thanks to the usage of energy-saving ultra-low-voltage processors. More interesting is that the HP EliteBook 1050 G1 consumes less energy, because it is almost equipped identically to the ZBook Studio G5. Probably, drivers make the difference in this case.
The charger supplies 150 W, more than enough for the maximum power consumption of 126 W.
Battery life
With its internal 97 Wh battery, the HP ZBook Studio G5 delivers a convincing result. In the Wi-Fi test, the ZBook almost managed 10 hours, more than an hour longer than the Dell Precision 5530. The Lenovo ThinkPad P1 performs even worse, thanks to its much smaller battery. Better in this respect is only the Apple MacBook Pro 15, because of its lower power consumption.

Pros
Cons
The HP ZBook Studio G5 managed a good showing in our review – that is why it scored 87% and the grade “good”. It shares most of its best features with the EliteBook 1050 G1.
Certainly this is not a big surprise, considering that the ZBook Studio uses the same stable Unibody chassis as the EliteBook 1050 G1 – just in gray instead of silver. Also identical: The comfortable keyboard, the big battery, the port selection, the commendable upgradeability, the great CPU performance and the touchpad. Our review unit even uses exactly the same AUO LCD panel as its EliteBook twin. The difference is less obvious at first glance: Most important is the different GPU – while the ZBook uses the CAD optimized Quadro P1000, HP utilizes the faster Nvidia GeForce GTX 1050 Max-Q in the EliteBook. This leaves the ZBook at a disadvantage in terms of GPU performance, at least until its Quadro P2000 configurations are available. Apart from that, it should be noted that only the ZBook has the option for a Dreamcolor display, the EliteBook 1050 G1 is sadly not offered with this display.
The disadvantage in terms of GPU performance persists in the comparison with the Lenovo ThinkPad P1 and the Dell Precision 5530: Both are offered with the Quadro P2000, while the ZBook is not, at least at the moment. Additional negative points are shared with the EliteBook 1050. This includes the higher weight compared with the competition, the bad position of the fan exhausts and the performance throttling while running on battery. Last but not least, the ZBook Studio G5 is also a very expensive device.
Convincing: The ZBook Studio G5 is a solid mobile workstation with few weak points.
Overall, the ZBook certainly has earned a recommendation from us. If it is to be preferred over the Lenovo ThinkPad P1 or the Dell Precision 5530 is a question of the taste and feature requirements.
HP ZBook Studio G5-4QH10EA – 03/26/2020 v7


المراجعات
لا توجد مراجعات بعد.